How Can You Pick The Best Dividend Stocks - Part 1
- Alex Artenie
- May 7, 2024
- 6 min read

Updated: Jun 7, 2024

This might surprise you, but a study conducted by Ned Davis Research on the returns of stocks in the S&P 500 between 1973 and 2023 found that companies that grew their dividends annually generated returns of 10.19%/year, as opposed to non-paying dividend stocks, which only yielded average returns of 4.27%/year.
Furthermore, a recent study by Market Scholars in November 2023 found that 46% of the 651 dividend-paying stocks analyzed were undervalued, indicating it may be favorable to employ this strategy for even those unfamiliar with dividend investing.
Thus, dividend investing is a strategy many have favored because of its potential to generate steady income while contributing to significant long-term wealth creation. By buying stocks of companies that pay dividends, investors benefit from regular payouts that can be reinvested to increase the size of the portfolio or be used as a steady source of income.
Dividend Investing is unique for its allure of providing passive income while also serving as the potential for long-term capital appreciation. Dividends are also a sign of a company's financial health and stability, making dividend-paying stocks a preferred pick for risk-averse investors.
Overall, the safety, income creation, and compounding wealth potential of dividend investing are crucial reasons many prefer the strategy. This article will outline how investors can use fundamental analysis to select the best dividend stocks. By employing the strategies outlined below, you can pick the best dividend stocks if you are looking to grow your wealth or generate passive income.
Before I reveal my secrets, I invite you to join my dividend-investing community. That way, you will not miss any essential articles and will learn to become a better investor. You will also receive a FREE welcome bonus—a 10-step guide to financial freedom.
Essential Financial Indicators for Dividend Stocks
There are a few financial metrics that investors need to monitor when picking out dividend-paying stocks to assess the sustainability, quality, and reliability of the dividends while also gauging the company's overall health. Here are the most critical measures every dividend investor should consider:
Dividend Yield
The dividend yield is the annual dividend payment divided by the price of a stock and is expressed as a percentage. It shows how much each investor would earn in dividends relative to the stock's price. Generally, a higher dividend yield is preferred, but assessing whether the yield is sustainable over time is essential.
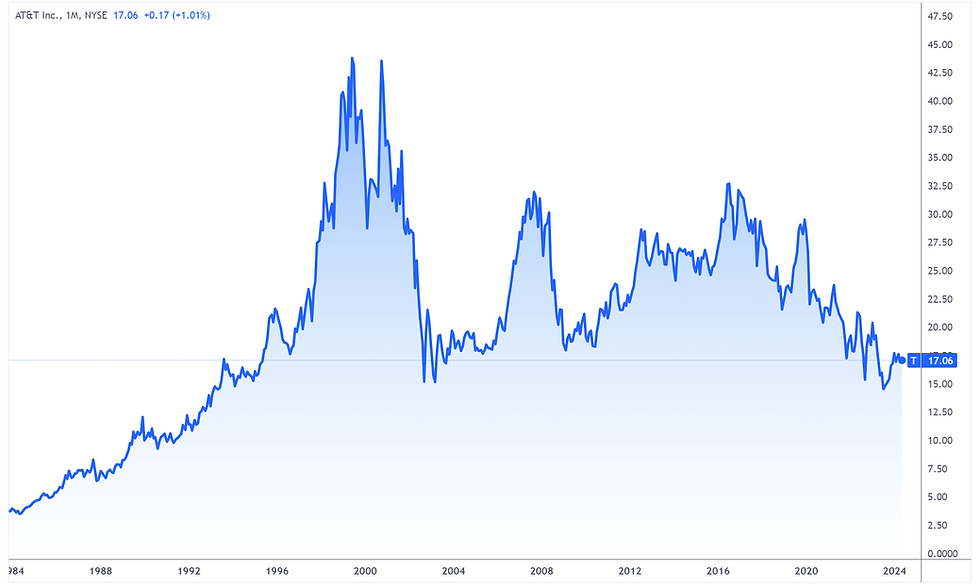
For instance, telecommunications giant AT&T is currently trading at a stock price of $16.84 while paying an annual dividend of $1.11/share. This implies that the stock has a dividend yield of 6.59%.
Dividend Growth Rate
The growth rate signifies the percentage growth in dividends per share from one year to the next. This measure is significant for investors looking at dividend payments that grow over time, as it shows how a company grows its profits in the long run while also distributing its profits.
For instance, Apple announced a 4.16% hike in its dividends quarterly in its latest report, hiking dividends from $0.24/share to $0.25.

Payout Ratio
The payout ratio, estimated as dividends per share divided by earnings per share (EPS), helps indicate what proportion of earnings a company uses to pay its shareholders dividends.
For instance, a high ratio (generally above 70-80%) is not sustainable since the company could be distributing too much of its profits to shareholders while not reinvesting enough in its own growth. For instance, the payout ratio of energy firm BP soared to 206% in the first quarter of 2020.
However, falling oil prices and the economic downturn from the COVID-19 pandemic forced the firm to halve its dividend from 10.5 cents per share to 5.25 cents. Conversely, a meager payout ratio may indicate a company is still in its nascent stages and is prioritizing growth, suggesting it has room to increase its dividends in the long run.
Payout Frequency
This measure indicates how often a company pays out dividends, whether monthly, quarterly, semi-annually, or annually. This can be important for investors who rely on dividend payments for regular income.
A Guide to Assessing Company Fundamentals
Return on Equity (ROE)
The ROE measures a business's profitability based on the profit it generates based on the money shareholders invest. A consistent, high ROE indicates efficient management and a strong potential for profitable growth, which can support ongoing dividend payments.
The ROE can be used to calculate the future Earnings Per Share of a firm in conjunction with the payout ratio, which in turn can help estimate the dividend payments for the future. For instance, if a stock has hypothetically delivered EPS of $4 in the previous year, with an ROE of 20% and has a payout ratio of 50%, then the future growth rate can be estimated as 10% (ROE into [1-Payout] ).
Based on this, the future EPS is estimated to be $4.4/share. If the stock keeps the same payout ratio (50%), the dividends would be $2.2/share.
Return on Assets (ROA)
The ROA measures how efficiently it can generate profits using its assets. A high ROA indicates effective management and a stock that pays stable dividends.
Debt/Equity
The Debt/Equity metric compares a company's total liabilities to shareholder equity. This metric helps investors understand how much a company relies on debt to finance its operations.
A lower debt-to-equity ratio is generally preferable for dividend-paying stocks, as excessive debt can compromise a company's ability to maintain its dividend payments, especially in economic downturns.
For instance, The world's largest brewer, Anheuser-Busch InBev, saw its Debt/Equity ratio surge from 1.717 in June 2016 to 3.203 when it acquired SABMiller. This high debt level was a key reason behind the decision to halve the dividend in 2018, as the company aimed to pay down its debt.
Interest Coverage Ratio
The interest coverage ratio can help assess a company's ability to meet its debt obligations by comparing its earnings before interest and taxes (EBIT) to its interest expenses. A higher ratio indicates that the company is well-positioned to cover its interest expense, which can be crucial in maintaining dividend payments during periods of uncertainty.
Liquidity Ratios
The Current and Quick Ratios measure a company's ability to meet its short-term financial obligations. The current ratio includes all current assets and current liabilities, while the quick ratio excludes inventory from assets. Both are important for understanding whether a company can handle its short-term liabilities without jeopardizing dividend payments.
Sector Performance
Analyzing the broader sector the company operates in can provide insights into potential risks and opportunities. Some sectors are known for their dividend reliability and growth, such as utilities and consumer staples, which tend to perform well even during economic downturns.
Economic Moat
This refers to a business's ability to maintain competitive advantages over competitors to protect its market share and profits. A robust economic moat can often lead to sustained dividend payments. Companies in the telecom, utility, or energy sectors have a great moat since new entrants need significant capital to build out the infrastructure required to establish a presence in the industry.
Harnessing Fundamental Analysis for Long-Term Wealth Growth
Fundamental analysis can help investors pick dividend stocks, as it provides a detailed evaluation of a company's financial health and industry position. When investors focus on key financial metrics and fundamentals, investors can identify stocks with sustainable dividends and the potential for long-term wealth accumulation.
It's important to remember that a well-rounded analysis should capture the current financial standing while anticipating future risks and opportunities, ensuring that the investments made can withstand the tests of time and market fluctuations.
Stay tuned for Part 2 of this article, which will further delve into strategies to pick out the best dividend stocks, including sectoral strategies, macroeconomic analysis, and the dividend discount model, which can help you estimate future dividend payouts.
I hope this article was interesting to you and perhaps inspired you to find some great dividend stocks that pay around your birthday so that you can buy a gift for yourself that will pay out every year from now on.
It is imperative that you educate yourself, become aware of your cognitive biases, and learn about investing before putting your hard-earned money at risk. I recommend you to check out my book, Live Off Dividends, where I dive into more details and prepare the reader for the investment journey.

I wish you reach your Dividend Horizon,
Artenie Alexandru
Disclaimer: The information provided is for general educational and informational purposes only and should not be construed as financial advice. Any investment or financial decisions you make based on information provided on this platform are done solely at your own risk. We do not provide personalized investment advice, nor do we recommend or endorse any specific investments, products, services, or strategies. You should consult with a financial advisor or professional before making any investment decisions. All investments come with risks and may lose value. Past performance is not indicative of future results. Any views expressed on this platform are those of the individual author and may not necessarily represent the views of the platform as a whole. The content provided is not intended to be a solicitation or offer to buy or sell any securities or financial instruments.


Comments